
Congratulations, you just launched a feature! You’ve done a ton of work and invested resources—now what? Bringing new features to market presents great opportunity for adding value to your company and your customers, not just as a result of the feature itself, but through the ensuing insights you can gather post-launch.
Did the work move the needle that you intended to move? Did it move to the extent you expected? If not, why? Are there customers that loved it? Did you encounter positive or negative unintended outcomes?
Capitalizing on new information is paramount in our uncertain market environment. Companies that do this well can course correct earlier and pinpoint opportunities to double down more quickly. Generating insights from this new information gives companies increased agility in decision-making, in the moment and into the future. That means the ability to turn a potentially disappointing outcome into a win, saving face in your organization and strategically contributing to your product roadmap.
We recently brought you part one of Putting Quant Data to Work with tactical steps to executing product strategy and launching features with Fuzy’s help. Next, as part of our ‘Jobs to Be Done’ in engineering series, we’re showing you how to close the loop on a feature launch by measuring performance and gathering insights.
Here, you’ll find the questions that every product leader should be asking after launching a new feature, along with how to answer them using Fuzy.
What did you want to measure? What could you actually measure?
It’s a very common experience to identify an opportunity to make an impact only to find that you have no good way to measure it. Often, this is a data collection issue––either you aren’t collecting the information you need, or you’re collecting everything and swimming in a sea of incoherent data.
Resolving this comes down to granting the right access and providing the right tools to the right people. Business users are frequently missing access to data (either they literally can’t access or don’t have the means to make sense of it). On the other hand, data experts are often missing context when trying to help. You simply need a better way to organize, interpret, and share data.
Did you accomplish your goal? How do you know?
It may seem obvious, but goals need to be set up front, along with an agreement on what success looks like and how to appropriately measure. Then, goals and their associated metrics must be monitored and continuously communicated. Often we go into post-release measurement with enthusiasm, then become distracted with the next feature or initiative and fail to continue monitoring to fully close the loop on impact and learnings. This not only hinders our progress on important business objectives, but it can also shortchange teams the opportunity for rapid, incremental gains through iteration, or early detection of unforeseen consequences.
What was the North Star metric you wanted to affect?
Ideally, all product decisions should tie to a North Star metric: a measurable leading indicator of an outcome, such as revenue or retention. Choosing the right North Star metrics and setting appropriate goals is unique to every product and can change as the business grows.
Unfortunately, identifying your North Star metrics is just the beginning—these are still output metrics and identifying the actionable input levers is an exercise in and of itself. Teams can tackle this through simple brainstorming of what inputs influence the output metric in question, while quantitatively sophisticated organizations construct everything from linear regression analyses to ML-models.
Most importantly, this is not a one-time process. Teams need to continuously monitor for impact and be ready to adapt as they experiment and learn. Since many metrics are interdependent, we must stay vigilant for unexpected counter reactions so we can promptly course correct.
Did what you expect to happen actually occur?
It’s important to establish how your team shares an understanding of your initial goals and hypotheses, what interventions were made, and what the outcomes were. Knowing what you hope or expect to occur helps your team develop better instincts and ideas no matter the result.
And while it is gratifying for your predictions to pan out, experience in this industry tells us to expect the unexpected! Whether it’s your entire hypothesis or a contributing factor you didn’t anticipate, there are always unexpected learnings––and your teams and leaders should be ready to pivot given new information and context.
Did they use it? Did you hit your adoption number? Did you celebrate that milestone?
At its heart, product development isn’t about chasing numbers on a dashboard. There are real humans on the other side of your keyboard. The folks that use your software want to succeed and want their customers to succeed. So, it’s important to know who they are and to deeply understand their goals, motivations, and frustrations.
As engineers and product leaders, if we’re doing our job right, we’re providing real value to these customers that will be realized as our product is adopted. Are the right team members getting access to our products? Are we onboarding them effectively and focusing on their key use cases?
If the answer to these questions is “yes,” are they achieving their desired outcomes through the use of the product? What better reason to celebrate and ensure we replicate that success?
Did this fundamentally change behavior and user pathways in a significant way?
Once you’ve figured out who’s doing what in your product, you need to know where and when they’re doing it. Where are people beginning in the customer journey? When are they getting to the next step? Are they getting stuck? Is there a more efficient way to get them across the line to value?
It’s tedious to get at this from manually constructed funnels in legacy tools. The process is prone to trial and error: It’s not always easy to identify and sequence events the way our customers experience them. As product teams, we often have our ideal “happy paths”, but wrapping our heads around the complexity and variance in the ways users interact with our apps can be surprising.
Did you discover anything unintended?
Whether a happy accident or collateral damage, there are almost always unintended consequences of decisions we make in product development. Regardless of whether the unanticipated results are positive, negative, or mixed, if you’re paying attention (and using the right tools), you can glean informative insights.
The virtuous cycle of design, build, measure, and learn leads us to continuous iteration, improvement, and innovation—often beyond the scope of what we originally intended.
How Fuzy answers these questions
What did you want to measure? What could you actually measure?
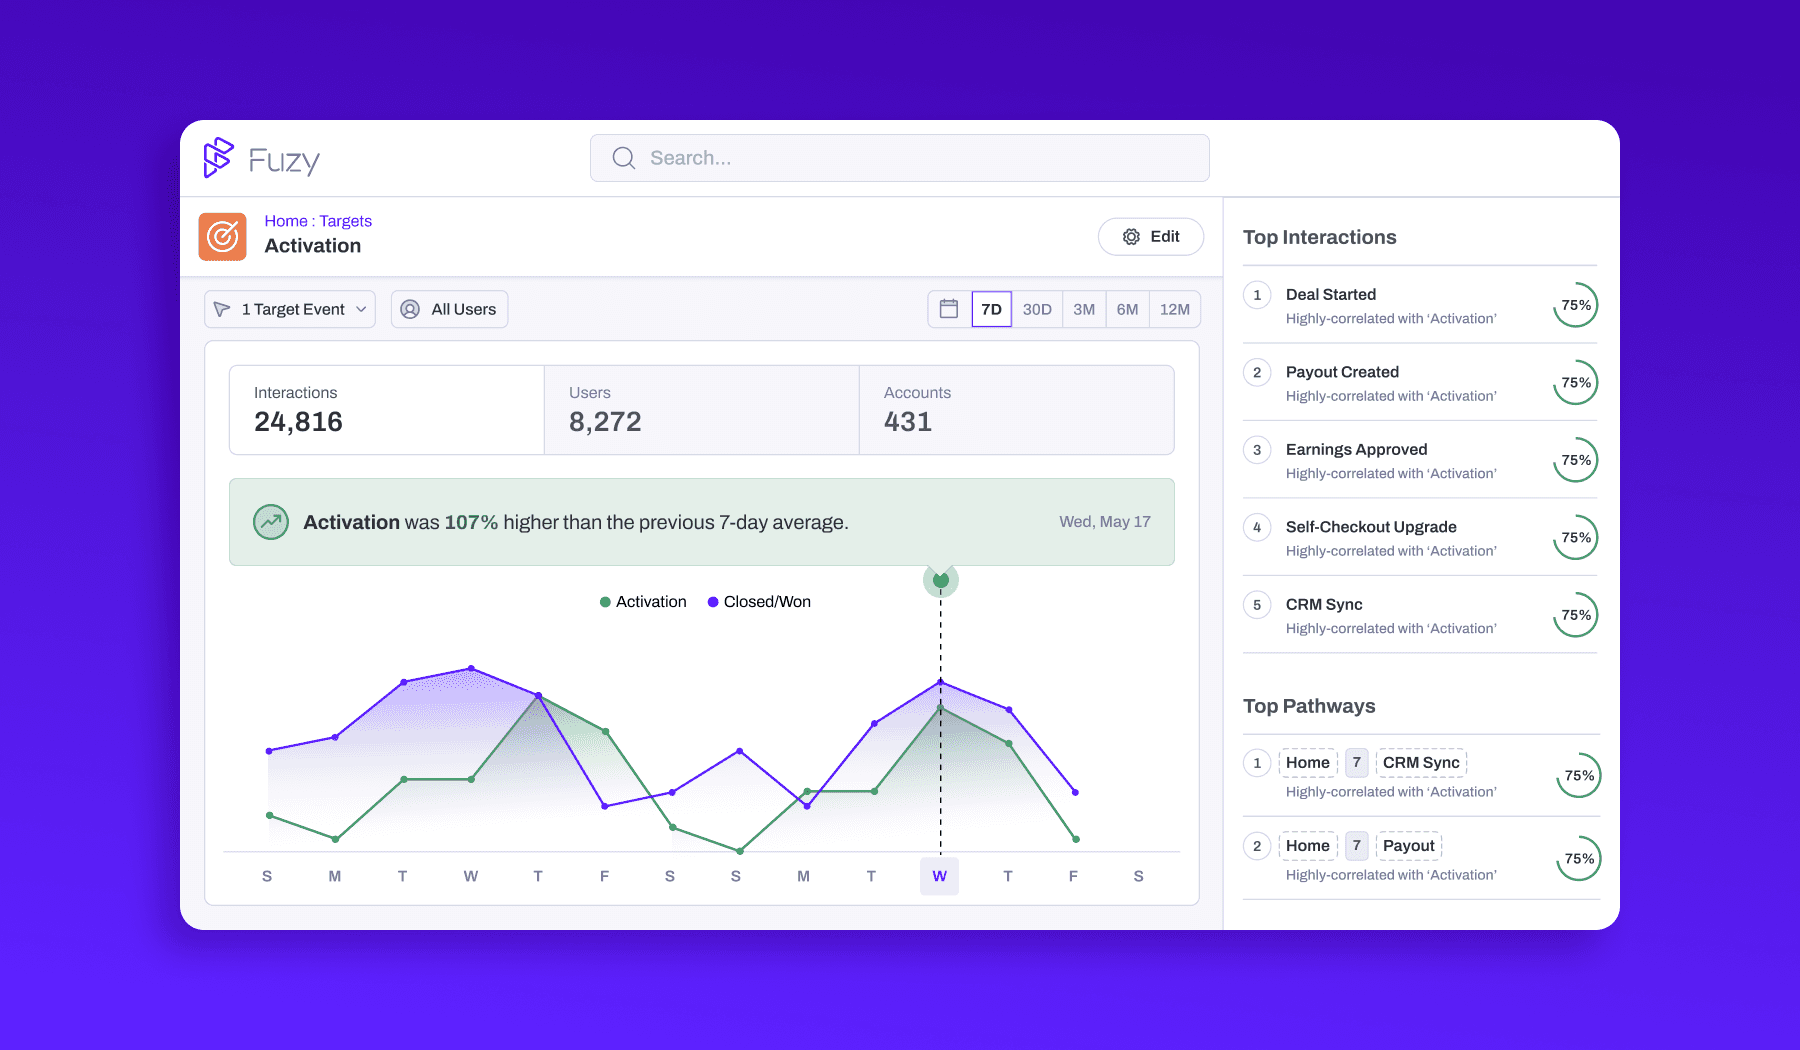
Targets in Fuzy are behavioral- or metric-based and can be combined and broken down by customer segments and accounts.
Fuzy gives you the ability to view behavioral (event) data, user and account profile data, and qualitative customer success data from multiple sources in a single view.
Fuzy provides robust out-of-the-box and custom metrics to immediately unlock insight into which user and account behaviors correlate to key business outcomes.
Did you accomplish your goal? How do you know?
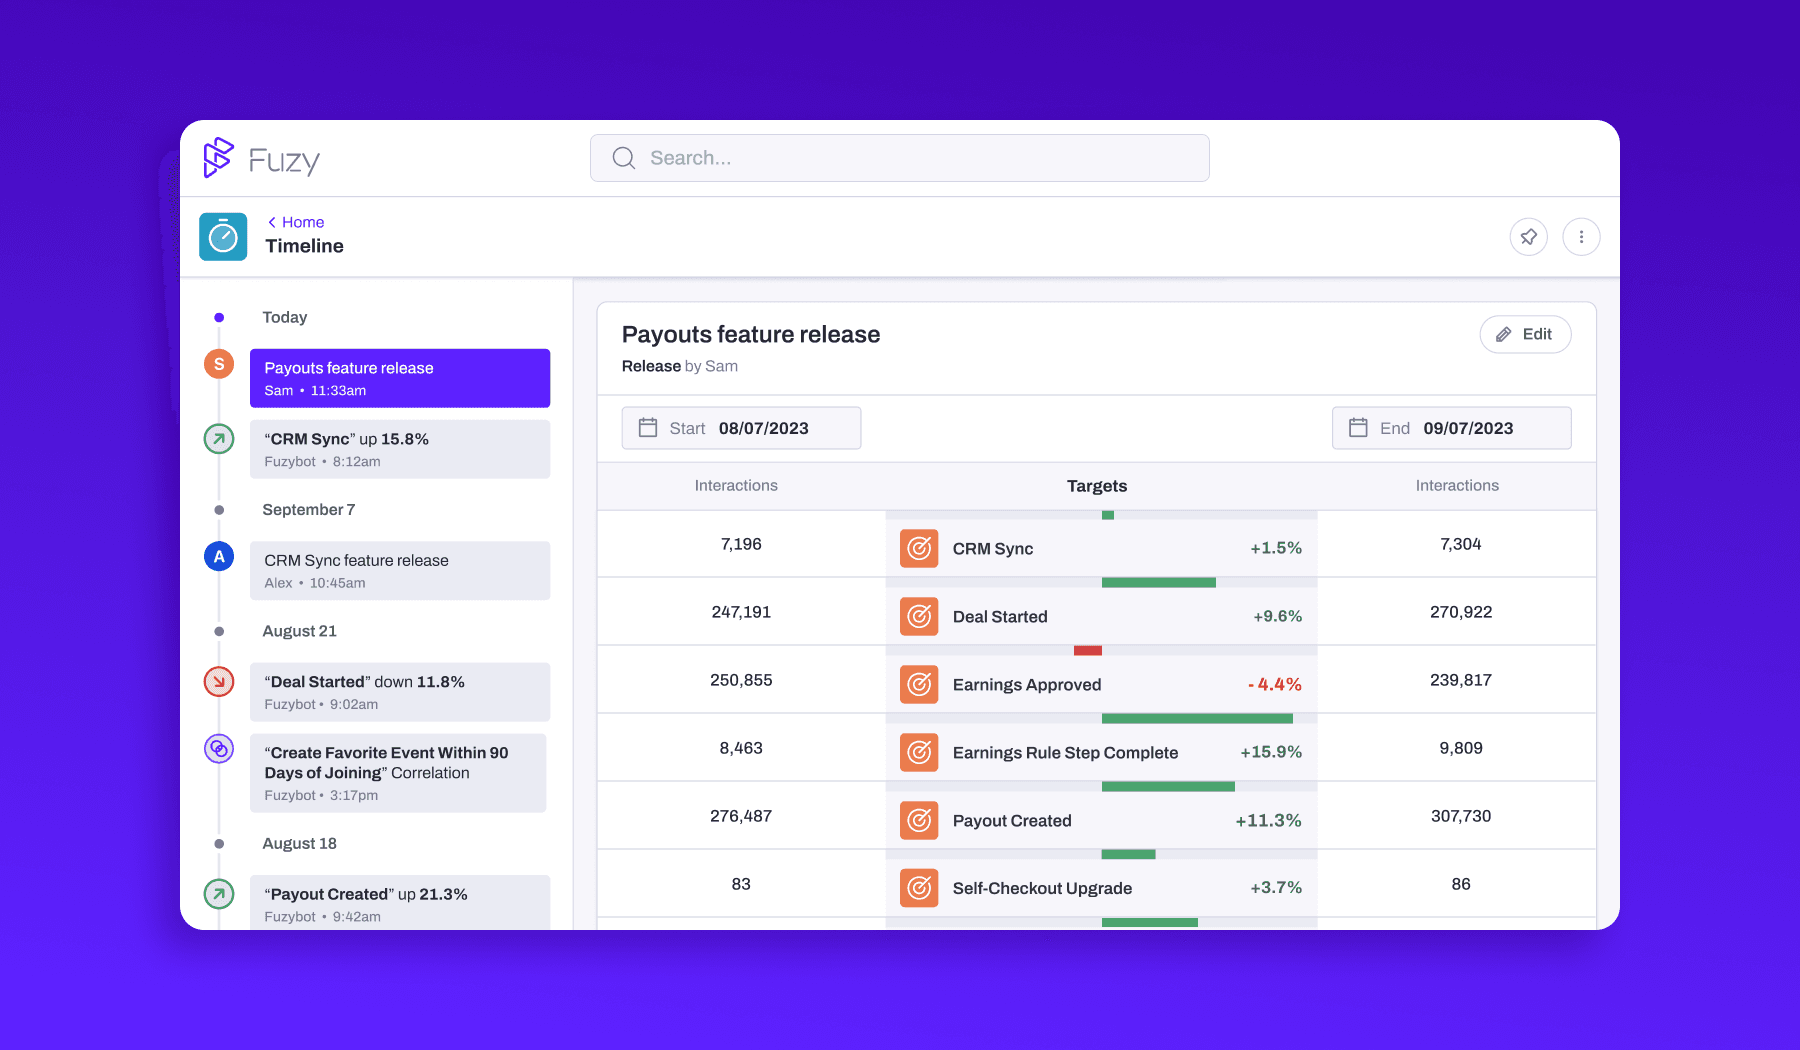
Fuzy sends email alerts and Slack notifications about Target goals and anomalies in your data to automatically monitor the things you’re watching closely.
Breakdowns by segment and account give you insight into what root cause led to hitting or missing your goals, along with correlations that can help you quickly understand why.
What was the North Star metric you wanted to affect?
Targets in Fuzy are a highly-visible and actionable way to discover what’s impacting your North Star and outcome metrics. Unlike BI dashboards or ad hoc analysis, Targets serve as a shortcut to uncover correlated behaviors and dispel opinions with data.
For each Target you add, Fuzy’s auto-ML generates correlation models and notifies you about significant changes. Models are continuously monitored and automatically rebuilt when accuracy degrades—expected and typically reflects a shift in your users’ behavior and/or profile characteristics.
Did what you expect to happen actually occur?
Fuzy delivers real-time analysis of product and customer data. Once you’ve defined your expectations in Fuzy as a Target, our predictive and correlation models arm you with insights that guide your future decision-making and evaluation of past decisions.
Fuzy turns your data into insights that require far less manual analysis, meaning they’re faster to act upon and give more context to aid with smart adjustments. Is there a recent change in user pathways, or a segment of accounts affecting your numbers? With Fuzy, you’ll know about it immediately.
Did they use it? Did you hit your adoption number? Did you celebrate that milestone?
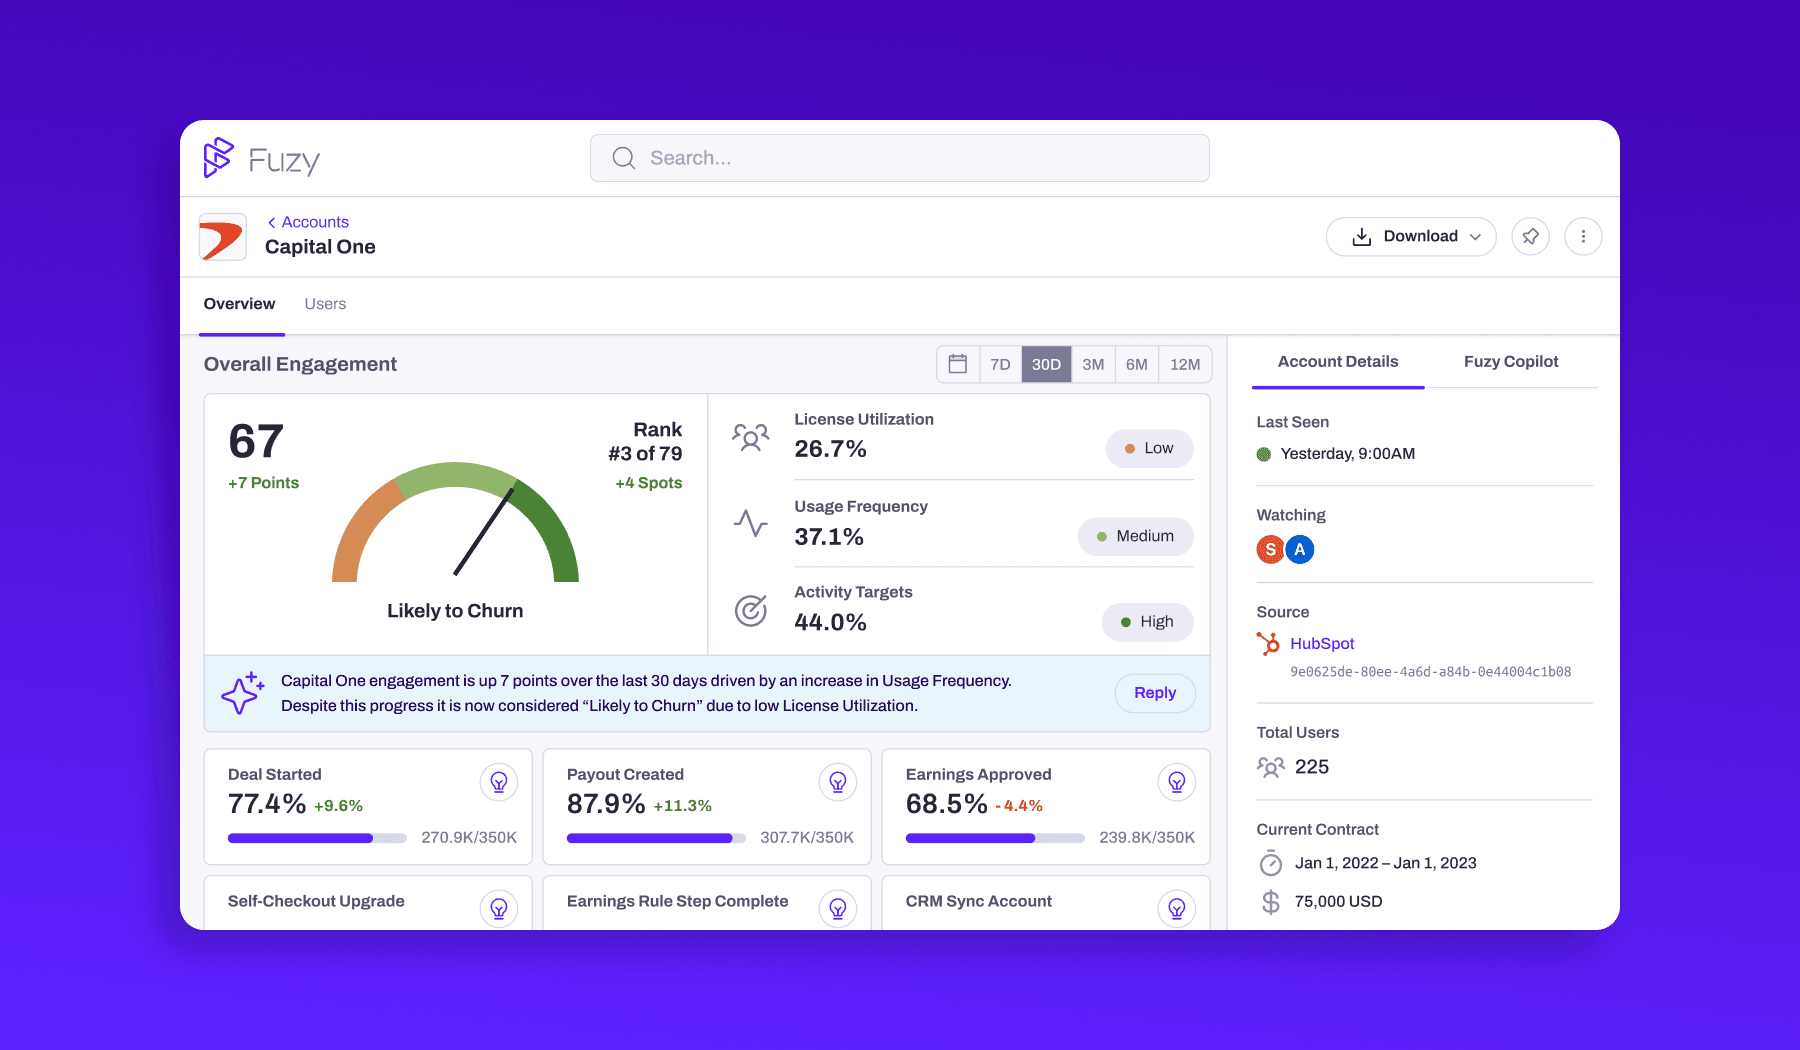
Fuzy brings rich context to product engagement insights by infusing CRM data through Segments and Customer Accounts so you can better understand who your customers are and how they behave in your apps (versus simple events counts).
Fuzy allows you to set behavioral and metric Targets goals that tighten feedback loops between product teams, customer success, and business operations.
Auto-generated insights are delivered via app, email, and Slack to let you know when it’s time to change course or time to celebrate.
Did this fundamentally change behavior and user pathways in a significant way?
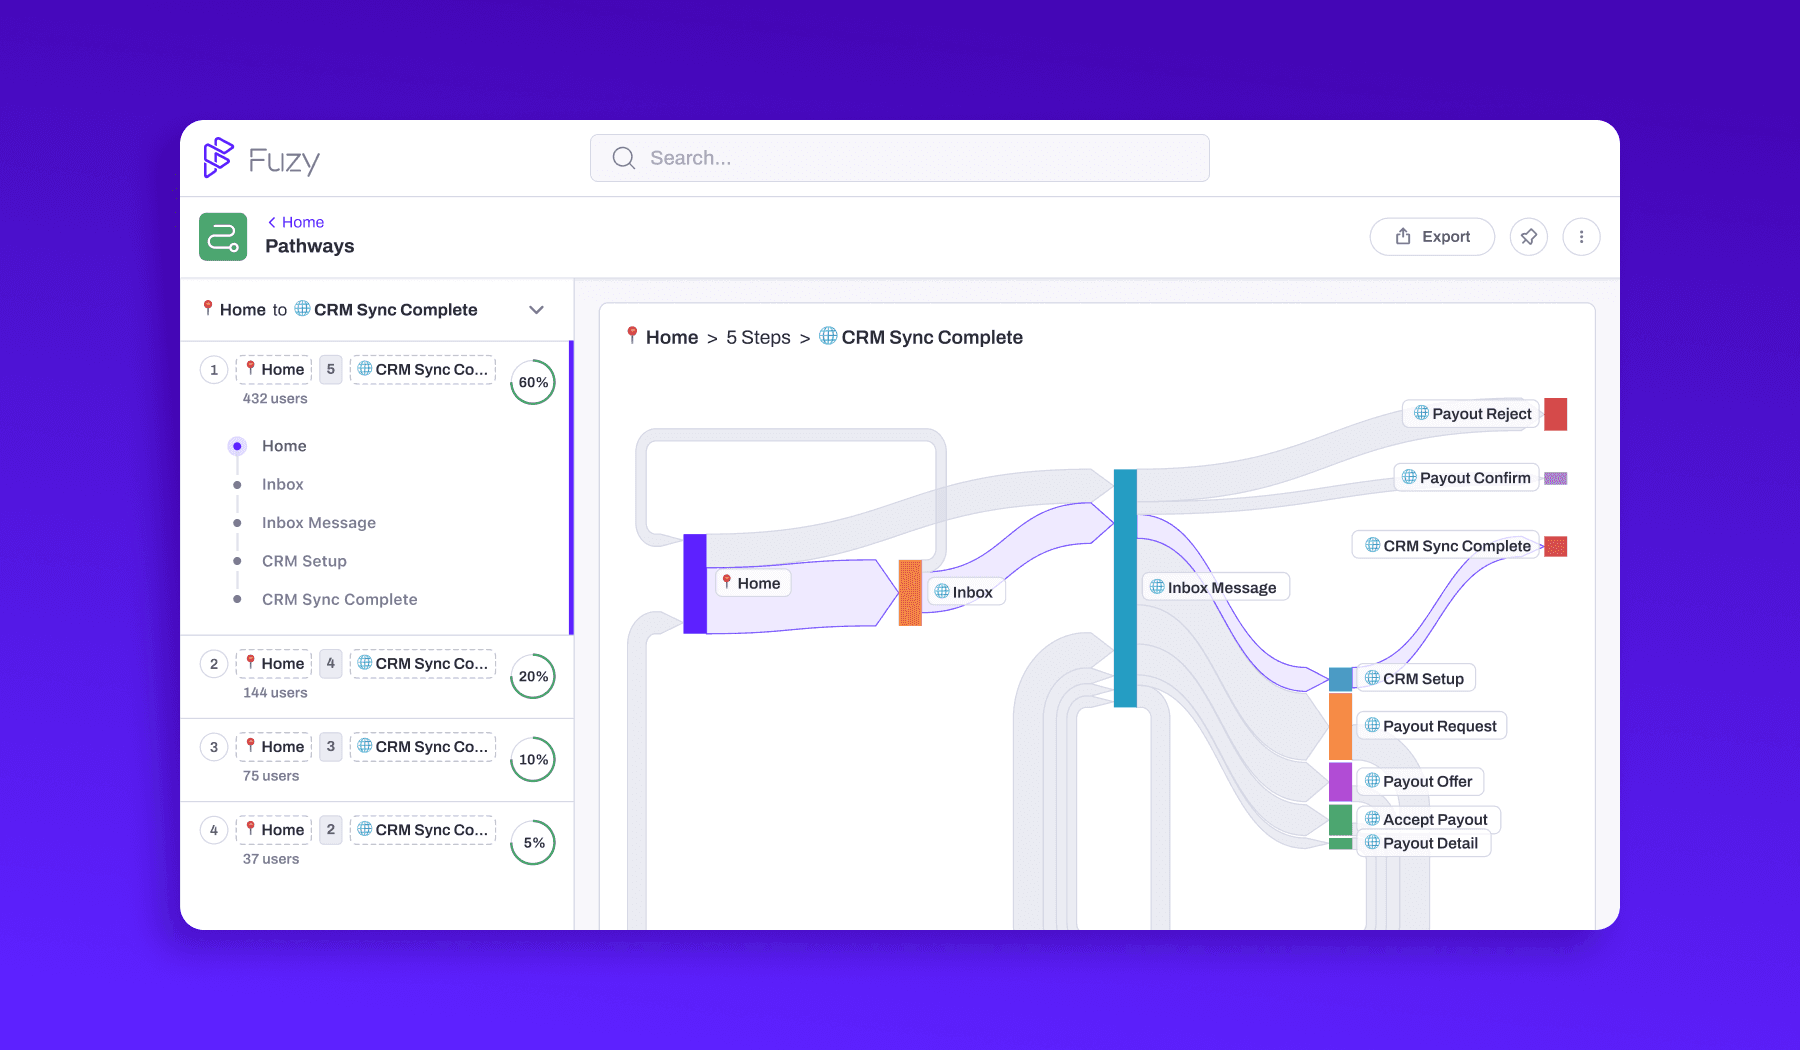
Fuzy Pathways help identify the ways customers actually navigate our apps without the upfront guesswork and manual funnel building.
Fuzy automatically constructs Pathways based on event traffic. When you’re investigating a specific part of your app, you can choose a start and/or end point event.
You can filter by segment to see if some user groups are behaving differently or are disproportionately impacted by a recent product change (intentionally or not).
You can apply time constraints to observe the “before and after” impact of product releases, trainings, and other changes.
Did you discover anything unintended?
Anomalies and correlations detected by Fuzy cast light on things you may not have been paying attention to and on connections you didn't know existed.
Overlaying context from CRM data, deployment and integration tools, and even institutional knowledge from your org via Annotations helps identify the reasons behind spikes and dips in your metrics.
Next in our "Jobs to Be Done" blog series, we’ll dive deeper into the Fuzy product and help you identify and prioritize your key goals (or Targets) in greater detail—a critical activity whether or not you rely on Fuzy to assist you.
We’re also bringing you more expert insight from product and customer success mavens who talked to Fuzy about the art and science of product decisions, the cost of making a bad decision, how to prevent or fix a bad decision, and the collaboration that takes place between teams to strengthen decisions from the start. Stay tuned for Q&As with Irina Tyshkevich of Octane and Leslie Jordan of Backflip.